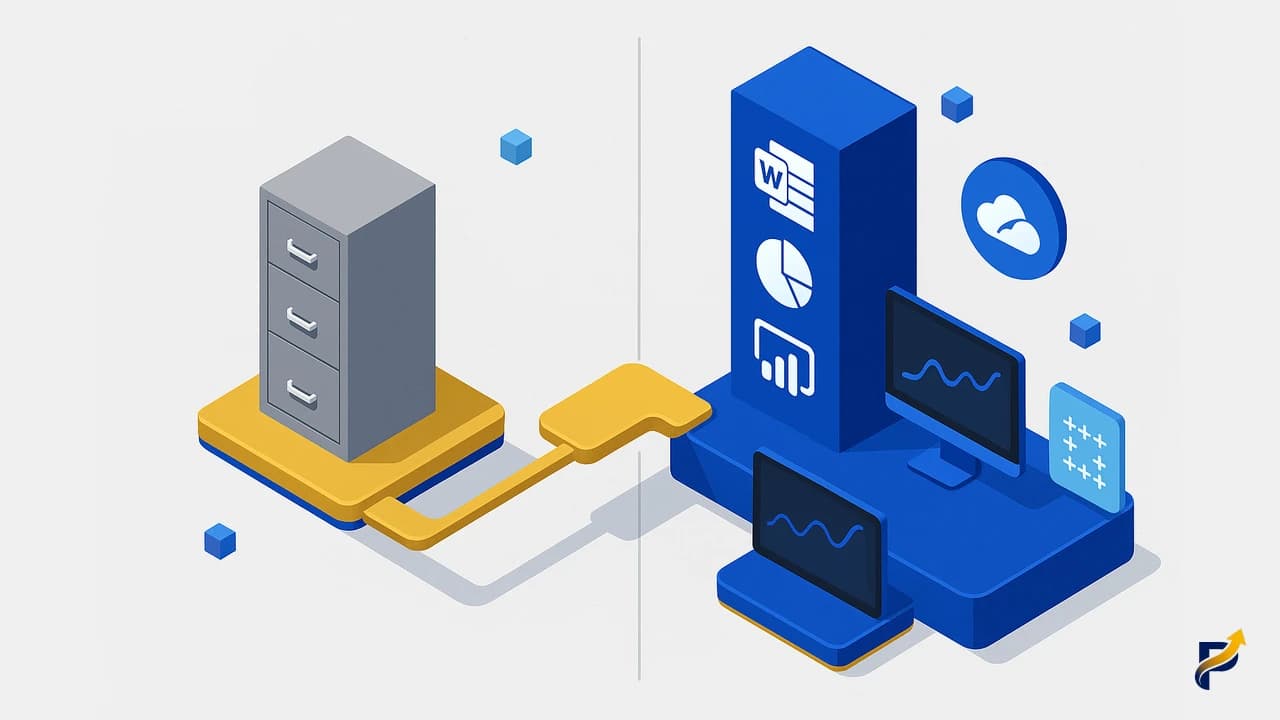
Business intelligence has become a board-level priority, and the choice between Power BI, Tableau, and Looker has significant financial and strategic implications. In 2026, that choice has become both more complicated and clearer: Microsoft raised Power BI pricing for the first time in approximately a decade (April 2025), Tableau has deeply integrated with Salesforce Einstein AI, and Google's enterprise Looker platform is now in its second year as a Gartner Magic Quadrant Leader.
This guide provides verified current pricing, updated Gartner positions, and a clear decision framework based on organisation type, existing technology stack, and data maturity — to help IT decision-makers choose the right BI platform without vendor marketing noise.
The BI Market in 2026: What Has Changed
Three significant shifts have occurred in the enterprise BI market since 2024.
Power BI pricing increased for the first time in about a decade. In April 2025, Microsoft raised Power BI Pro from $10 to $14/user/month and Power BI Premium Per User (PPU) from $20 to $24/user/month. This was announced by the Microsoft Power BI team as the first price increase since Power BI was launched. Power BI remains substantially cheaper than Tableau and enterprise Looker, but the gap has narrowed slightly.
P-SKU Power BI Premium capacity plans were retired. In July 2024, Microsoft retired P-SKU capacity plans (P1, P2, P3, P4) for new purchases and replaced them with Microsoft Fabric F-SKUs. Organisations with existing P-SKU agreements can continue, but new enterprise capacity purchases now use Fabric F-SKUs, aligning Power BI with the broader Microsoft data platform.
Generative AI became a differentiating capability. All three platforms have invested heavily in AI features: Power BI Copilot (generally available on Fabric F64+/PPU), Tableau Pulse and Tableau Agent, and Looker's Gemini integration. AI-assisted report creation, natural language queries, and automated narrative insights are now expected features of enterprise BI.
Power BI in 2026: New Pricing, Copilot, and Fabric
Power BI remains the dominant BI platform globally, with tens of millions of commercial users across Microsoft's cloud customer base.
Updated Pricing (April 2025 Increase)
- ▸Power BI Free: Available with limited sharing and no premium features
- ▸Power BI Pro: $14/user/month (raised from $10 in April 2025)
- ▸Power BI Premium Per User (PPU): $24/user/month (raised from $20)
- ▸Microsoft Fabric F-SKUs: Shared capacity for enterprise deployments — F2 through F2048, replacing the retired P-SKU plans
Power BI Copilot
Power BI Copilot is generally available for organisations on Fabric F64 capacity or Premium Per User (PPU). Copilot capabilities include: generating complete reports from a natural language description, suggesting DAX measures, creating report summaries, and answering questions about data through the Q&A visual. For Microsoft 365 organisations already using Microsoft Copilot for productivity tools, Power BI Copilot extends the same interface into data analytics.
Microsoft Ecosystem Advantage
Power BI connects natively to every Microsoft product: Excel, SharePoint, Teams, Dynamics 365 (Business Central, Finance and Operations, Customer Service), Azure SQL, Azure Synapse, OneLake, and more. Reports and dashboards can be embedded in Teams channels, shared through SharePoint pages, and accessed in the Microsoft 365 mobile apps. Azure Active Directory manages access control through the same identity system used for all Microsoft products. For organisations already in the Microsoft ecosystem, this integration is a material efficiency advantage.
Enhanced open-source Power BI apps are included at no extra licence cost for Business Central, Finance, Sales, and Supply Chain data. All Power BI apps are now open-source on GitHub, allowing customisation.
Tableau in 2026: Einstein AI and Salesforce Integration
Tableau, acquired by Salesforce in 2019, has increasingly integrated with the Salesforce platform — to the benefit of Salesforce customers and with some implications for standalone Tableau users.
Tableau Pricing 2026
Tableau's pricing is structured as:
- ▸Tableau Creator (full authoring): $75/user/month (Standard) or $115/user/month (Enterprise/Advanced Management)
- ▸Tableau Explorer (interactive analysis): $42/user/month (Standard) or $70/user/month (Enterprise)
- ▸Tableau Viewer (read-only dashboards): $15/user/month (Standard) or $35/user/month (Enterprise)
Tableau Pulse and Tableau Agent
Tableau Pulse, announced at Dreamforce 2024, delivers AI-powered metric monitoring — the platform proactively surfaces anomalies and insights from your data and delivers them as digests to stakeholders, rather than requiring them to open and navigate a dashboard. This fundamentally changes how analysts and business users interact with data.
Tableau Agent (also from Dreamforce 2024) enables conversational data exploration — asking questions of your data in natural language within the Tableau interface, connected to the Salesforce Einstein Copilot ecosystem.
When Tableau Excels
Tableau's visual analytics capabilities remain among the best in the market. The drag-and-drop interface is genuinely intuitive for business analysts without heavy SQL or scripting backgrounds. For organisations with heterogeneous data across multiple cloud providers — AWS, Azure, Google Cloud, Snowflake, Databricks — Tableau's connectivity breadth is strong. The Salesforce integration is a clear advantage for customers with Salesforce CRM as their primary customer data source.
Looker in 2026: Enterprise vs Looker Studio Clarified
An important clarification: the term "Looker" covers two distinct Google products with very different use cases and price points.
Enterprise Looker (google.com/intl/looker)
The original Looker platform is a fully featured, model-driven BI and analytics platform. It is built around LookML — a modelling language that creates a governed semantic layer between your data warehouse and end users. Enterprise Looker is primarily used by data engineering teams at large organisations that need a single governed data model across the entire company.
Enterprise Looker pricing is custom — negotiated directly with Google Cloud. Typical starting contracts are $50,000/year and scale considerably higher depending on number of users, data volume, and features. See Google Cloud Looker pricing for current information.
Looker Studio (Free Self-Serve Tool)
Looker Studio (available at lookerstudio.google.com) is a free self-service reporting tool, formerly known as Google Data Studio. It is excellent for creating dashboards connected to Google Analytics 4, Google Ads, Google Sheets, and BigQuery — at no cost. Looker Studio Pro adds collaboration features and support at $9/user/month.
Looker Studio is not the same product as enterprise Looker. If you are evaluating BI tools for an SME or mid-market business context, Looker Studio (free) is not a like-for-like comparison with Power BI Pro or Tableau Creator.
When Enterprise Looker Excels
Enterprise Looker is most compelling for: large organisations with multiple data teams that need a single, governed semantic layer; data engineering teams comfortable with LookML and version-controlled data model management; Google Cloud-native organisations using BigQuery as the primary data warehouse; and companies requiring complex, customisable embedded analytics in their own products.
Verified Pricing Comparison 2026
| Platform | Standard Tier | Notes |
|---|---|---|
| Power BI Pro | $14/user/month | Raised from $10 in April 2025 |
| Power BI PPU | $24/user/month | Includes Copilot AI access |
| Tableau Creator | $75/user/month | Standard tier; Enterprise at $115 |
| Tableau Explorer | $42/user/month | Standard tier |
| Tableau Viewer | $15/user/month | Standard tier |
| Enterprise Looker | Custom (from ~$50k/year) | Model-driven semantic layer platform |
| Looker Studio | Free | Limited self-serve; not enterprise Looker |
| Looker Studio Pro | $9/user/month | Collaboration features |
Sources: Power BI pricing announcement, Tableau pricing page, Google Cloud Looker pricing.
Gartner Magic Quadrant 2025 Positions
The 2025 Gartner Magic Quadrant for Analytics and Business Intelligence Platforms (free reprint via Microsoft) positions all three platforms as Leaders:
| Vendor | Years as Leader | Notable |
|---|---|---|
| Microsoft (Power BI) | 18th consecutive year | Highest Ability to Execute in 2025 |
| Tableau (Salesforce) | 13th consecutive year | Strong Completeness of Vision |
| Looker (Google Cloud) | 2nd year | Recognised for data-driven enterprise deployments |
| Qlik | 15th consecutive year | Included for reference |
All four are recognised as mature, enterprise-grade platforms. The Gartner MQ positions reflect overall market perception and breadth of capability — they should be read alongside specific feature evaluations relevant to your requirements.
AI and Copilot Features Compared
All three platforms made significant AI investments in 2024–2025:
Power BI Copilot (generally available): natural language report generation, DAX measure suggestions, automated report summaries, Q&A visual. Requires Fabric F64 capacity or PPU. Integrated with Microsoft Copilot for M365 ecosystem.
Tableau Pulse: proactive AI-driven metric monitoring; delivers insights as digests to stakeholders without requiring dashboard navigation. Tableau Agent (Dreamforce 2024): conversational data exploration within Einstein Copilot.
Looker: Gemini-powered natural language queries integrated into Google Cloud AI; conversational analytics; data exploration via AI assistant. Tightly integrated with BigQuery ML and Vertex AI.
For organisations already invested in the Microsoft AI ecosystem (Copilot for M365, Azure OpenAI), Power BI Copilot provides the most seamless AI integration into existing workflows.
The Decision Framework: Which Tool for Which Organisation?
Choose Power BI if:
- ▸You are already on Microsoft 365, Azure, or Dynamics 365
- ▸Your BI users are a mix of business analysts and technical staff
- ▸Cost efficiency at scale is important ($14 vs $75/user is substantial)
- ▸You want AI features without additional infrastructure investment
- ▸You use Business Central, SharePoint, or Teams as core business platforms
Choose Tableau if:
- ▸You are already on Salesforce and need deep CRM data integration
- ▸Your data team has strong existing Tableau skills and a high productivity premium
- ▸You have heterogeneous multi-cloud data sources across AWS, GCP, and Azure
- ▸Your analysts prioritise visual drag-and-drop authoring over scripting
- ▸You need polished executive dashboards with advanced visualisation flexibility
Choose Enterprise Looker if:
- ▸You are a Google Cloud-native organisation using BigQuery as primary data warehouse
- ▸You need a governed semantic layer managed by a data engineering team using version-controlled LookML
- ▸You are building embedded analytics into your own software product
- ▸Your data team is comfortable with code-first BI development
The free/low-cost tier: Looker Studio (free) and Power BI Free/Pro are both reasonable starting points for organisations with limited budgets — Looker Studio for Google Analytics-centric reporting, Power BI Pro for Microsoft ecosystem organisations.
The Microsoft 365 Case Study: Real Cost Comparison
For a 50-user organisation where all users need BI access:
| Platform | Monthly Cost | Annual Cost |
|---|---|---|
| Power BI Pro (50 users) | $700/month | $8,400/year |
| Tableau Creator (50 users) | $3,750/month | $45,000/year |
| Annual saving: Power BI vs Tableau | — | $36,600/year |
This does not account for implementation cost differences or productivity differences between platforms — but for a Microsoft 365 organisation, the $36,600/year licence cost saving is significant, particularly for SMEs.
For organisations requiring PPU (Copilot AI access): 50 users × $24/month = $1,200/month ($14,400/year) versus $45,000/year for Tableau Creator. Still a $30,600/year annual saving.
PapaSiddhi Technologies specialises in Power BI implementation and dashboard development for clients in the UK, Netherlands, Denmark, UAE, and USA. Our Power BI and data analytics team can design, build, and maintain your BI solution — whether you are starting from scratch or migrating from another platform. Contact us to discuss your BI requirements.
Frequently Asked Questions
Common questions about Power BI vs Tableau vs Looker 2026 answered by the PapaSiddhi expert team.